


⚡ TL;DR
- Finance Dashboard brings billing, receivables, invoice sources, expenses, and margins into one centralized view.
- Track scheduled but unbilled work and billing gaps to identify areas that may need attention.
- See where invoice lines come from, including timesheets, products, and billable expenses.
- Monitor receivables, overdue balances, DSO, ageing, and collection rates to support better cash-flow management.
- Compare expenses and margins by practice to understand where profitability is strongest or needs review.
- Use CRMLeaf Dashboard 2.0 to turn finance data into clearer insights and more focused monthly decisions.
Most service firms know their revenue figure. Fewer can say, quickly, where cash is stuck, which work has not been invoiced, or which practice is earning its margin.
The answers usually sit in separate reports, so finance leaders spend their week assembling numbers instead of acting on them.
The new Finance Dashboard in CRMLeaf Dashboard 2.0 is built to change that.
It gives owners, finance heads, and delivery leaders one place to review billing, invoice sources, receivables, and margin, using data already held in CRMLeaf.
This release note explains what the Finance Dashboard is, what each of its four areas shows, and how it helps you spot potential areas to investigate.
What Is the CRMLeaf Finance Dashboard?
The CRMLeaf Finance Dashboard is a professional services finance dashboard and CRM finance dashboard in one.
It brings billing and revenue, invoice sources, receivables and collections, and expenses and margin into one view, built on the records your team already maintains in CRMLeaf.
It is part of CRMLeaf Dashboard 2.0, the redesigned reporting layer that gathers business views in one place.
Finance is one of several dashboards, alongside areas such as sales, projects, resources, and time.
Instead of exporting data to a spreadsheet, you read the position directly.
This makes professional services financial reporting faster and easier to repeat each month.
Why Finance Visibility Matters for Professional Services
A services business sells time, expertise, and outcomes. Revenue depends on how well delivery turns into invoices, and how well invoices turn into cash. A gap at any step slows the whole chain.
Three problems appear again and again in firms without a shared finance view:
- Invoicing lag. Work is delivered, but the invoice goes out late, so cash arrives late.
- Hidden gaps. Billable hours or expenses never reach an invoice, and nobody notices until a review.
- Uneven collections. A small number of clients hold most of the overdue balance, but effort is spread evenly.
A strong financial reporting dashboard does not fix these by itself. However, it makes them visible early, which is when they are cheapest to address.
Good finance analytics turns scattered records into signals you can act on.
Four Areas, One Finance Dashboard
The dashboard is organised into four tabs. Each answers a different question that finance and operations teams ask every month.
| Tab | Question it helps answer | What you review |
| Billing & revenue | Are we invoicing what we deliver? | Invoiced value, scheduled but unbilled, recurring revenue, credit notes |
| Invoice sources | Where do invoice lines come from? | Timesheets, products, expense recharges, manual lines |
| Receivables | How fast are we collecting? | Outstanding, overdue, ageing, DSO, collection rate |
| Expenses & margin | Are we keeping what we earn? | Expense recovery, gross and operating margin by practice |
Billing and Revenue Dashboard
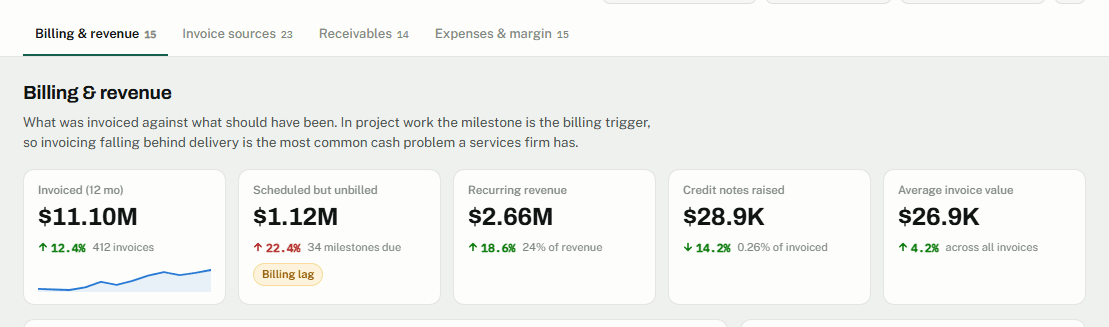
The first tab works as a billing and revenue dashboard.
Headline tiles cover invoiced value over twelve months, scheduled but unbilled amounts, recurring revenue, credit notes raised, and average invoice value.
Below the tiles, charts compare billings against what was scheduled, and break revenue down by billing model: milestone, time and materials, recurring or retainer, one-off invoice, and EMI plan.
A quote-to-cash view follows the journey from accepted quote to invoice to payment. Billing lag by practice shows where invoicing runs slowest.
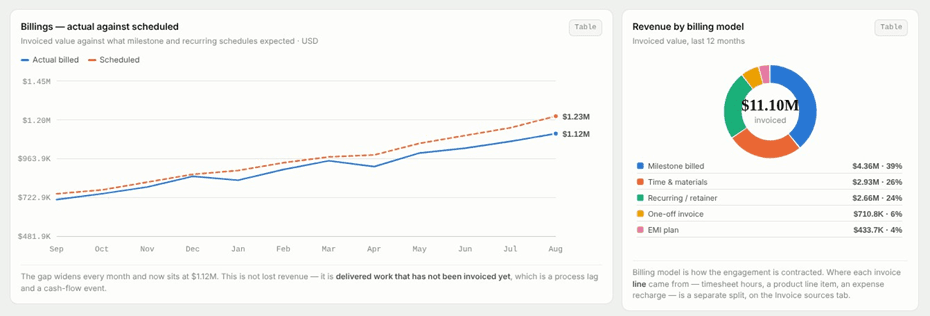
One point deserves care. Scheduled but unbilled work is delivered work that has not been invoiced yet.
It is a process lag and a cash-flow event, not lost revenue. Similarly, a gap between accepted and invoiced value is backlog, not leakage.
The dashboard keeps those two ideas apart, so you do not mistake timing for loss.
Invoice Sources: See Where Invoice Lines Come From
The second tab explains how invoices are built.
CRMLeaf generates invoice lines from billable timesheet hours, product line items, and billable expense recharges.
Milestone, fixed, and recurring amounts sit alongside them.
Charts show invoiced value by line source, a funnel from billable hours to invoice lines, and recovered versus unrecovered expense recharges.
Invoice composition by client shows which sources drive each account.
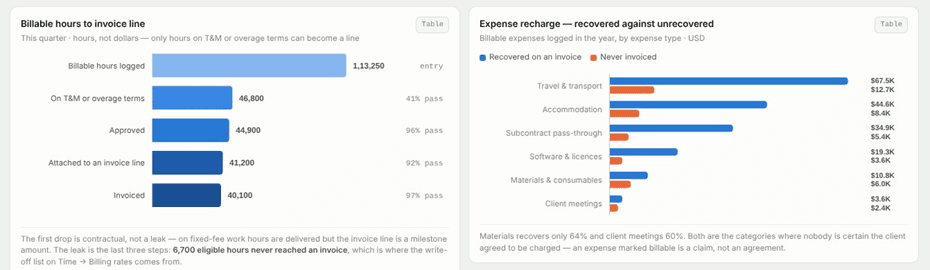
For Time Tracking users, this tab closes a familiar loop. Hours logged by the team can be traced through to the invoice lines that bill them.
That makes it easier to ask whether eligible hours were invoiced at all.
Receivables Dashboard: Collections and Cash Flow
The third tab is a receivables dashboard. It starts with outstanding receivables, overdue balance, days sales outstanding (DSO), collection rate, and bad-debt provision.
Supporting charts cover receivables ageing in five buckets, the DSO trend, invoiced against collected, overdue by client, payment behaviour by client, and payments by method.
A ledger adds detail such as 90+ day exposure, average days beyond terms, partially paid invoices, online payment adoption, and reminder effectiveness.
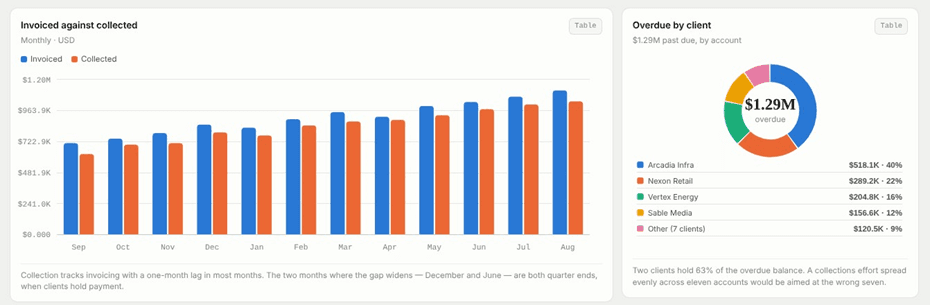
The ageing view carries a practical lesson. Buckets show how old a balance is, but they do not apply an escalation rule on their own.
Your team still decides when a reminder becomes a call. When two clients hold most of the overdue balance, account-level follow-up usually beats spreading effort evenly.
Expenses and Margin: Know What You Keep
The fourth tab turns to cost. Tiles show total expenses, billable expenses, expense recovery rate, gross margin, and operating margin.
Charts cover expense composition, expense by category and by department, income against expense, and margin against target by practice.
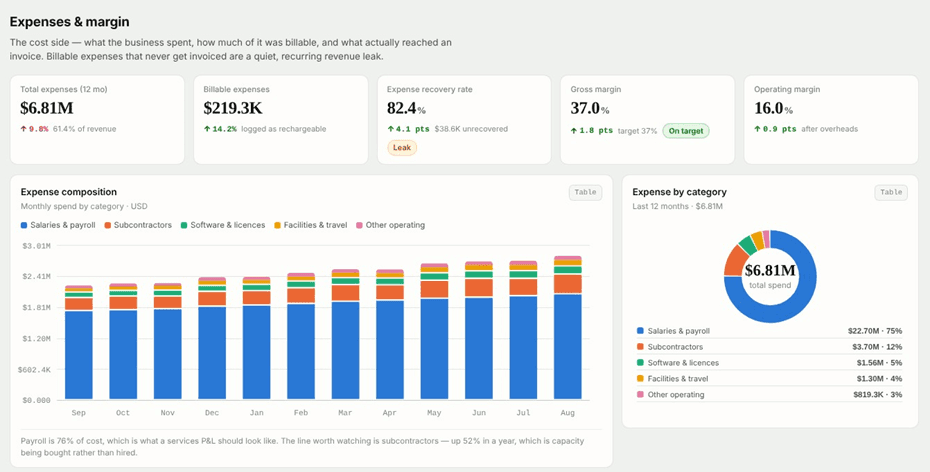
A ledger adds cost per billable hour, overhead ratio, vendor spend concentration, subcontractor spend, and margin by practice.
Practice-level margin matters most. A firm can look healthy overall while one practice sits below target.
Please note how margin is derived. Gross margin is computed from timesheet hours valued at an hourly cost based on CTC. It is a reporting layer, not a stored field. Treat it as a management view, and confirm it against your accounting system.
Spot Potential Revenue Leakage Early
The Finance Dashboard does not claim to find lost money. Instead, it highlights potential areas to investigate.
Four checks in the Invoice sources tab are good places to start:
- Eligible hours never invoiced. Billable hours that have no matching invoice line.
- Unrecovered billable expense. Expenses marked billable that were not recharged.
- Manual invoice lines. Lines with no source record behind them.
- Ordered but not invoiced products. Product quantities ordered that never reached an invoice.
Each item is a prompt for review. A flagged hour may have a valid reason, such as a goodwill write-off.
The value of the dashboard is that the question gets asked, with evidence, in the same month.
One limitation applies. CRMLeaf generates invoice lines from timesheets, products, and expenses, but it does not stamp a source field on the line.
The source split is therefore inferred by joining back to records, and manual lines cannot be classified.
Want to see these tabs on your own data? Schedule a Demo or Start Free Trial.
How the Finance Dashboard Connects Across CRMLeaf
Finance numbers rarely stand alone.
They depend on how sales, delivery, and time data flow into billing. That is why a finance dashboard inside a PSA software platform is more useful than a standalone report.
Deals closed in CRM software become quotes and invoices.
Work planned in Project Management becomes milestones and billable hours. Capacity set in Resource Management shapes cost and margin. Finally, Invoicing & Finance records the invoices and payments you review here.
In short, the dashboard reads across modules rather than beside them. A drop in margin can be traced to a project, then to the hours behind it.
Who Benefits From the Finance Dashboard?
| Role | What they look for | Best starting tab |
| Owner or founder | Cash position and margin by practice | Expenses & margin |
| Finance head | Ageing, DSO, collection rate | Receivables |
| Billing or accounts team | Unbilled work and invoice composition | Billing & revenue |
| Delivery or operations lead | Hours that never reached an invoice | Invoice sources |
A Note on Data and Accuracy
Every number in a finance view is only as good as the record behind it.
The CRMLeaf Finance Dashboard reads from the invoices, payments, timesheets, and expenses your team already maintains.
It does not create new financial data, and it does not replace your accounting system.
Because of this, we suggest three habits. First, approve timesheets on schedule. Second, record payments promptly. Third, review manual invoice lines regularly, since they carry no source record.
Together, these keep the dashboard reliable and the conclusions you draw from it defensible.
How to Get Started
Open the Dashboard menu in CRMLeaf and select the Finance dashboard. Then review one tab at a time.
A simple monthly routine works well:
- Billing: check scheduled but unbilled work and billing lag.
- Sources: review the leakage checks and investigate flagged items.
- Receivables: focus on the clients holding most of the overdue balance.
- Margin: compare each practice against its target.
Because the dashboard uses your CRMLeaf records, its accuracy depends on clean inputs. Timesheets, expenses, and invoices should be kept current for the views to be useful.
Smarter Finance Insights, Built Into Your Workflow
The Finance Dashboard in CRMLeaf Dashboard 2.0 gives services firms a clearer, shared view of billing, invoice sources, receivables, and margin.
It helps teams see timing gaps, ask better questions about invoicing, and focus collection effort where it counts.
It works best when the underlying records are current, and when results are treated as signals to investigate. Used that way, it turns monthly finance review from a data-gathering task into a decision-making one.
Ready to explore the Finance Dashboard? Schedule a Demo or Start Free Trial.
Disclaimer: All figures, charts, and names shown in the images are illustrative examples from the dashboard mockup, not customer data or guaranteed results. Features and layouts may differ in your CRMLeaf account.