


⚡ TL;DR
- The CRMLeaf Sales Dashboard brings pipeline, conversion activity, and client account insights into one reporting view inside CRMLeaf Analytics.
- Pipeline shows open and won deal value, average deal size, pipeline coverage, stage distribution, and stalled deals.
- Conversion & Activity covers win rate, lead-to-deal conversion, sales cycle length, overdue follow-ups, activity levels, and loss reasons.
- Clients & Accounts covers active clients, revenue concentration, repeat business, net revenue retention and client portal adoption.
- A reporting-period filter (plus location and department) and role-based deal visibility keep each user focused on the data relevant to them.
- Reviewed regularly, these metrics help sales teams spot where deals stall, where leads leak, and where revenue depends on too few clients.
Introduction
A sales dashboard helps teams manage performance, which involves more than counting deals won. Sales teams also need to understand the value and health of their pipeline, find where leads drop out, keep follow-ups on schedule, and see how revenue spreads across client accounts.
However, when this information sits in separate reports, sales managers struggle to see where opportunities are progressing and where attention is needed.
Fortunately, a sales dashboard solves this by putting the numbers in one place. Within CRMLeaf’s CRM and business management platform, the Sales & CRM dashboard consolidates them into three areas: Pipeline, Conversion & Activity, and Clients & Accounts.
Next, this guide walks through each area, the metrics it contains, and how sales teams can use them in day-to-day sales management.
What’s Included in CRMLeaf Sales Dashboard 2.0
Sales Dashboard 2.0 rests on a single idea: every number a sales team reviews should sit in one place and come with a clear definition. It includes:
- Three focused tabs — Pipeline, Conversion & Activity, and Clients & Accounts — instead of separate standalone reports.
- Configurable pipeline stages and multiple pipelines, so charts reflect the stages your team actually uses.
- Stall-focused deal ageing, measured from the last stage move rather than the creation date.
- Loss-reason and win-rate-by-source reporting, showing why deals fall through and which channels actually close.
- Account health metrics such as revenue concentration, repeat business, net revenue retention and client portal adoption.
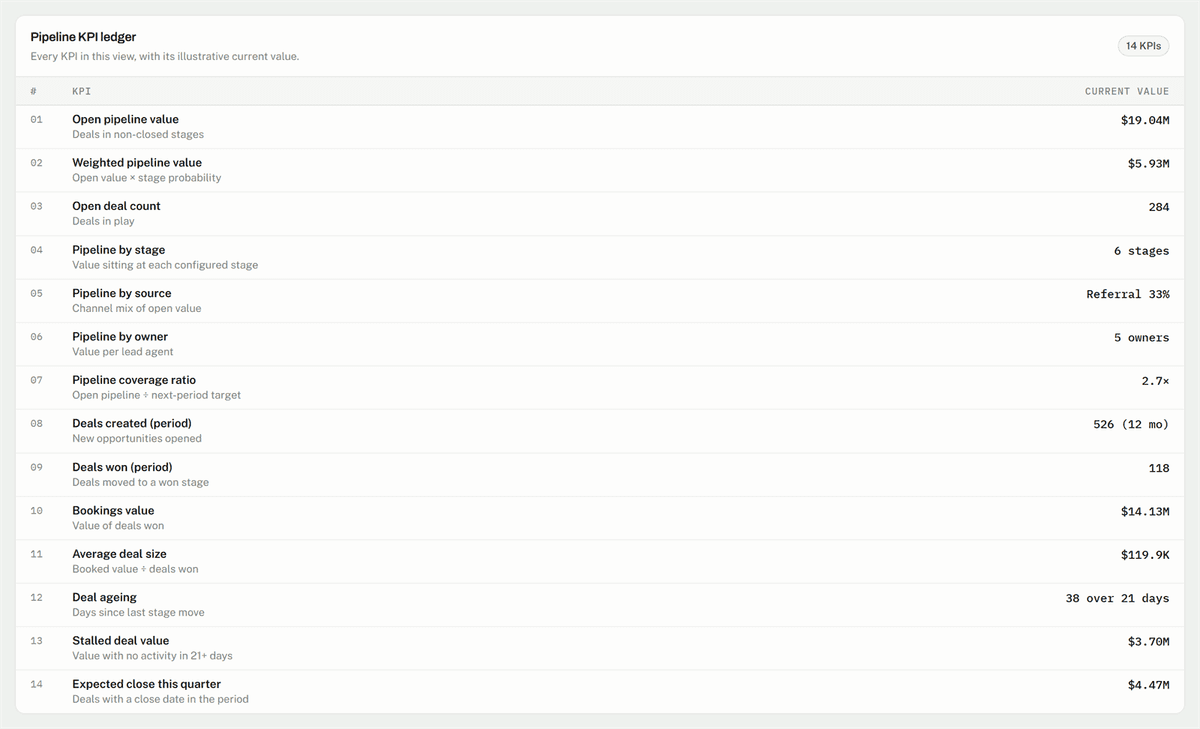
- A KPI ledger on every tab that spells out the formula behind each metric.
- A table view on every chart, so you can read or check the underlying figures exactly.
- Role-based visibility, so representatives see their own deals and managers see the whole team.
What Is the CRMLeaf Sales Dashboard?
A sales dashboard is a reporting interface that brings key sales metrics and trends together in one place, so teams can review activity, evaluate deal progress and understand how opportunities move through the sales process.
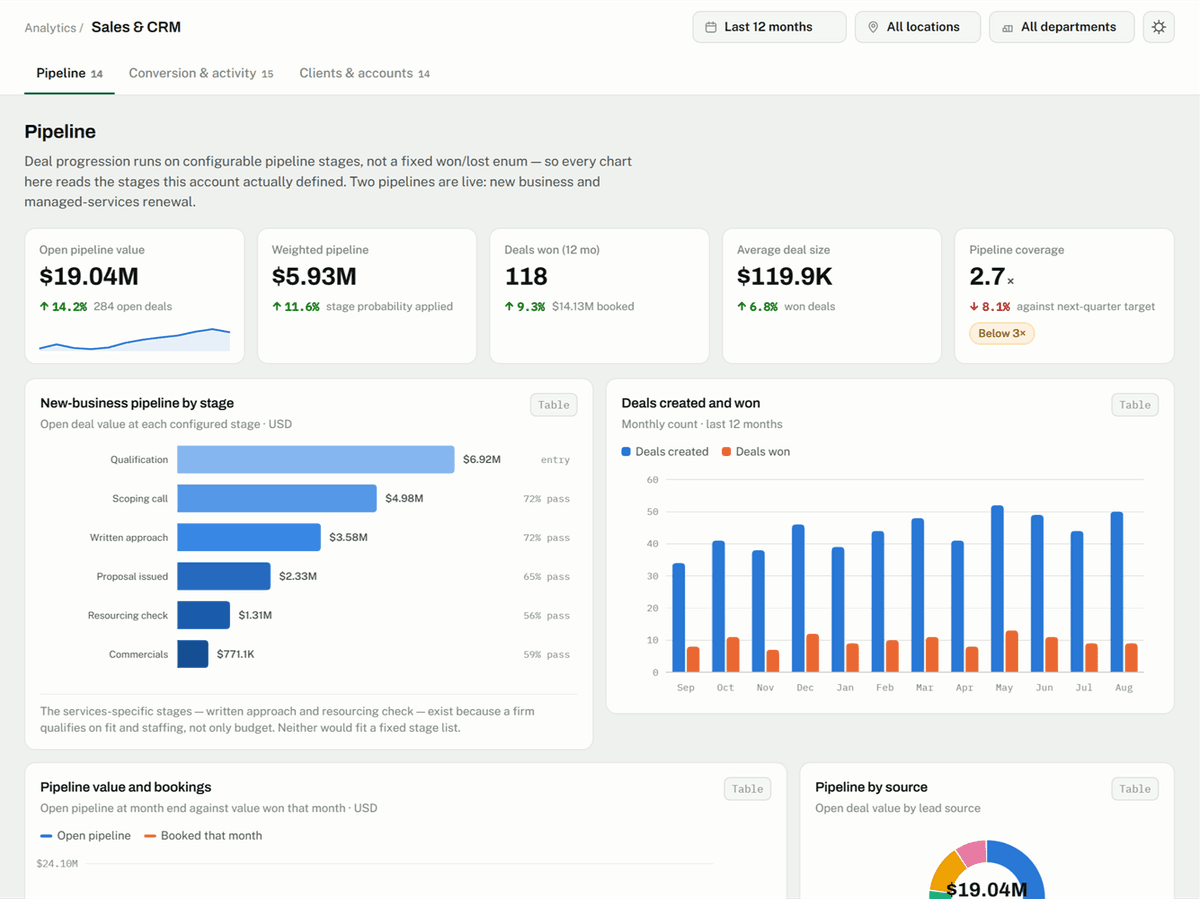
In CRMLeaf, the Sales & CRM dashboard sits within Analytics and has three tabs:
- Pipeline: Open deal value, deal progress, stage distribution and deal ageing.
- Conversion & Activity: Win rates, lead conversion, sales cycle length, follow-ups and loss reasons.
- Clients & Accounts: Active clients, revenue by account, concentration, repeat business and portal engagement.
Each tab combines headline metric tiles, charts with short explanatory notes, and a KPI ledger that defines every metric shown, so users can see exactly how each number comes together.
Key Features of the CRMLeaf Sales Dashboard
1. Monitor Sales Pipeline Performance
The sales pipeline represents opportunities as they move through your sales stages. In CRMLeaf, pipeline stages are configurable rather than a fixed list, so the dashboard reflects the stages your team actually uses. An account can also run more than one pipeline — for example, one for new business and one for renewals.
Key pipeline metrics include:
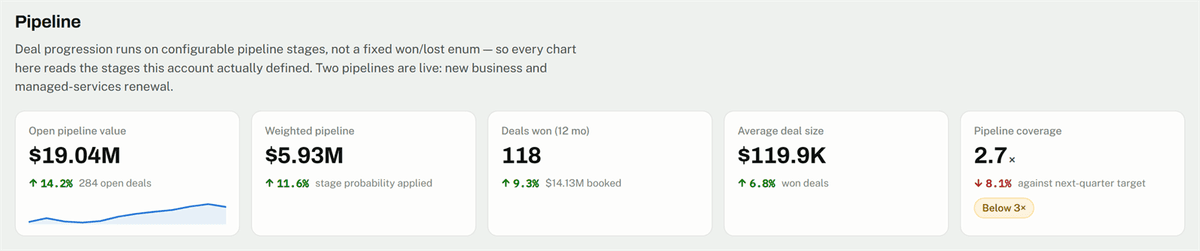
- Open pipeline value: The value of all deals in non-closed stages, alongside the open deal count.
- Weighted pipeline: Open value multiplied by each stage’s probability.
- Deals won: The number of deals moved to a won stage in the period, with total bookings value shown alongside.
- Average deal size: Booked value divided by the number of deals won.
- Pipeline coverage: Open pipeline divided by the next period’s target — a quick check on whether there is enough pipeline to hit the number.
- Pipeline by stage: A funnel showing how much open value sits at each configured stage.
- Pipeline by source and owner: How open value is distributed across lead sources and deal owners.
- Deal ageing: Open deals grouped by days since their last stage move (0–7, 8–14, 15–21, 22–45 and 46+ days).
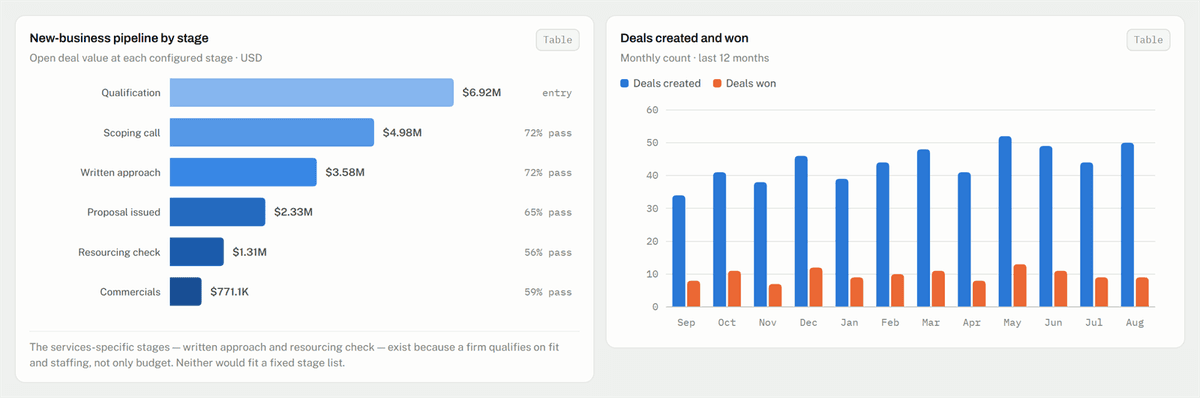
In addition, the tab charts deals created against deals won each month, and open pipeline value against monthly bookings.
Read Deal Ageing in the Sales Dashboard
Of these, deal ageing deserves particular attention. Because it measures time since the last stage move rather than time since the deal was created, it highlights stalled deals — often an earlier warning sign than a missed close date. The ledger also reports stalled deal value (value with no stage movement in 21+ days) and expected close this quarter.
A large open pipeline may look promising, but managers should read it alongside coverage, stage distribution, and ageing before drawing conclusions about future sales.
2. Track Lead Conversion and Sales Activity
However, creating leads is only one part of the process. Teams also need to know whether leads become deals, how many deals are won, why others are lost, and whether follow-ups are happening. Because CRMLeaf writes every action on a deal to its activity timeline, it can report on activity without extra data entry.

Win rate: Deals won divided by deals closed in the period. The dashboard also breaks win rate down by lead source and by owner.
Lead-to-deal conversion rate: The share of captured leads that became tracked deals.
Sales cycle length: The median number of days from a deal’s first stage to won, calculated on won deals. Using the median keeps one unusually long deal from distorting the figure.
Overdue follow-ups: Follow-ups whose date has passed with no action taken, along with the number of deals they affect.
Activities per won deal: The average number of logged notes, calls and follow-ups behind each won deal — a view of how much effort it takes to close.
Sales Dashboard Conversion Charts
Visualizations on this tab include:
- Lead-to-won funnel: Leads captured → qualified → deal opened → proposal issued → won.
- Win rate by lead source: Which channels actually close.
- Win rate and sales cycle trend: Both metrics over twelve months, indexed to a common baseline so you can compare them honestly on one chart.
- Sales activity by type: Follow-ups, notes and calls, and proposals sent per month.
- Closed deals by outcome: Won deals alongside loss reasons such as price, no decision, capability fit, and timing.
Additionally, the KPI ledger adds deal-to-proposal and proposal-to-win rates, the no-decision rate, response time to new leads (capture to first logged action) and agent goal attainment.
In short, reviewed together, these answer practical questions: Are leads progressing into deals? Where is the biggest drop-off? Which sources convert? Why do deals fall through? Are follow-ups slipping?
As with any metric, interpret them in context — especially when the number of closed deals is small or activity logging is incomplete.
3. Understand Client Accounts and Revenue
Sales performance doesn’t end when a deal closes. Therefore, the Clients & Accounts tab looks at the account base after the win: who the revenue comes from, how much of it repeats, and how engaged clients are. For teams that deliver projects and services after the sale, this connects naturally with CRMLeaf PSA Software, where won deals turn into client work.

Active client accounts with activity in the selected period, with new and dormant clients shown alongside.
Revenue concentration: The share of revenue that comes from the top three clients. A high figure signals dependence on a small number of accounts.
Repeat business share: The share of booked value that comes from existing clients.
Net revenue retention: Revenue from existing accounts compared with the previous year — above 100% means the existing base is growing.
Portal adoption: The share of clients actively using the CRMLeaf client portal. Because clients are real user accounts, portal activity is a measurable signal.
Sales Dashboard Client Charts
Charts on this tab include:
- Revenue by client: Invoiced value for the top ten accounts.
- Clients by segment: Active accounts by industry.
- New against repeat business: Booked value by quarter, split between new and existing clients.
- Client portal engagement: Adoption of capabilities such as viewing invoices, e-signing proposals, raising tickets and paying online.
- Client revenue by quarter: A heatmap of invoiced value for the largest accounts, making growing and declining accounts easy to spot.
Additionally, the KPI ledger adds average revenue per client (invoiced value ÷ active clients), client lifetime value, client satisfaction rating, online payment adoption and contact coverage.
Note that invoiced value differs from cash collected or recognized revenue; use your finance reports for those measures.
For example, a business may notice that three accounts represent close to half its invoiced revenue, or that one major account has declined for several quarters in a row. That can prompt a review of account relationships and upcoming opportunities. The dashboard surfaces the pattern; decisions should also consider contract terms, client history, and other business context.
4. Filter Reports for Relevant Insights
A dashboard is more useful when each user sees the data relevant to them. CRMLeaf supports this in three ways.
Filters. The dashboard header provides:
- Reporting period: Month to date, last 12 months, financial year, quarter, or a custom range.
- Location: Focus on a specific office or location.
- Department: Narrow the view to a department.
Role-based visibility. Deal visibility follows ownership, so a sales representative sees their own deals while a sales manager sees the whole team’s. The charts are the same; the scope adapts to the user’s role.
Table view. Every chart has a Table toggle that shows the same data as rows and values — useful when you need exact figures or want to check a number before sharing it.
When comparing metrics, keep the reporting period and filters consistent — different periods or scopes will produce different results.
How Sales Teams Can Use the CRMLeaf Sales Dashboard
Review Pipeline Health
First, review open pipeline value, coverage, and the stage funnel. Then check deal ageing for deals that haven’t moved stage in three weeks or more. The goal isn’t simply a bigger pipeline — it’s confidence that deals are progressing and that there is enough coverage to meet target.
Identify Conversion Challenges
Read lead-to-deal conversion, win rate, and the lead-to-won funnel together. If the steepest drop is between lead and qualified, look at lead routing and response time. If many deals close lost with “no decision”, look at qualification. Win rate by source shows which channels deserve more investment.
The dashboard highlights patterns; it doesn’t by itself explain why they occur.
Monitor Follow-Up Activities
Because follow-ups slip quietly, review overdue follow-ups and activity by type regularly, and discuss outstanding items with the deal owners. Accurate activity logging matters — incomplete records reduce the usefulness of every activity metric.
Understand Client Revenue Distribution
Next, use the Clients & Accounts tab to review revenue by client and by quarter, watch revenue concentration in the top three accounts, and track repeat business and net revenue retention. As a result, this supports account reviews and decisions about where to deepen relationships and where to broaden the client base.
Support Sales Review Meetings
In practice, the three tabs give sales reviews a consistent running order: pipeline health, conversion and activity, then client revenue. Discussions stay grounded in shared numbers — provided your team keeps the underlying CRM records up to date.
How to Use the CRMLeaf Sales Dashboard
Step 1: Open the dashboard. First, sign in to CRMLeaf, go to Analytics and select Sales & CRM. What you see depends on your account configuration and role permissions.
Step 2: Select the reporting period. Next, choose the period to analyze — month to date, last 12 months, financial year, a quarter or a custom range. Use the same period when comparing metrics.
Step 3: Apply location or department filters. Then, narrow the view by location or department if needed.
Step 4: Review the Pipeline tab. After that, check open value, coverage, the stage funnel, and deal ageing. Note deals or stages that need attention.
Step 5: Review Conversion & Activity. Check win rate, lead-to-deal conversion, sales cycle length, overdue follow-ups, and loss reasons.
Step 6: Review Clients & Accounts. Check revenue concentration, repeat business, net revenue retention, revenue by client and quarterly trends.
Step 7: Identify follow-up actions. Finally, decide which deals, activities, or accounts need attention, and confirm details in the underlying records before making important decisions. Each tab’s KPI ledger defines the exact formula behind every metric.
Business Benefits of Sales Dashboard Reporting
Better visibility into the sales pipeline: Stage, coverage, and ageing views show not just how much pipeline exists, but whether it is moving.
A clearer view of lead conversion: Funnel, win-rate, and loss-reason reporting show where leads drop out and why deals are lost.
More structured follow-up monitoring: Overdue follow-ups and activity reporting help managers catch slipping deals early – provided activity records are accurate.
Improved understanding of client revenue: Client-level revenue, concentration, repeat business, and retention show how dependent the business is on a few accounts and how well it grows existing ones.
More informed sales decisions: Reviewing pipeline, conversion, activity, and client revenue together gives managers a broader set of indicators for planning.
However, these benefits depend on data quality, the metrics enabled in your account, and how consistently the team uses the reports.
Who Can Benefit From the CRMLeaf Sales Dashboard?
- Sales managers: Review pipeline health, team win rates, loss reasons, and follow-up discipline.
- Business owners: Understand pipeline coverage, client concentration, and revenue retention.
- Sales representatives: Review their own deals, stalled opportunities, and overdue follow-ups.
- Account managers: Track revenue by client, repeat business and portal engagement.
- Operations teams: Use sales reporting to support planning and internal reviews.
Overall, the most relevant views depend on each user’s role, permissions, and the data maintained in CRMLeaf. Evaluate the dashboard against your actual reporting requirements before deciding whether it meets your needs.
Final Thoughts
Understanding sales performance takes more than counting deals won. Businesses need visibility into pipeline health, lead conversion, follow-up discipline and how revenue spreads across client accounts.
Overall, the CRMLeaf Sales Dashboard brings these together across its Pipeline, Conversion & Activity, and Clients & Accounts tabs, with a KPI ledger that defines every metric. For the best results, keep CRM records up to date, use consistent reporting periods and interpret the numbers in the context of your sales process.
If you’re evaluating CRM and sales reporting tools, explore CRMLeaf to see how it fits your team’s workflow.