
⚡ TL;DR
- Project Visibility: Track active projects, milestones, and delivery progress.
- Budget Control: Compare estimated and actual hours to spot budget overruns.
- Delivery Performance: Monitor overdue tasks, missed milestones, and SLA attainment.
- Cost Insights: Understand estimation accuracy, overrun costs, and rework.
- Profitability Tracking: Review project margins, revenue forecasts, and delivery costs.
- Better Decisions: Use CRMLeaf Projects & Delivery Dashboard 2.0 to identify risks early and improve project outcomes.
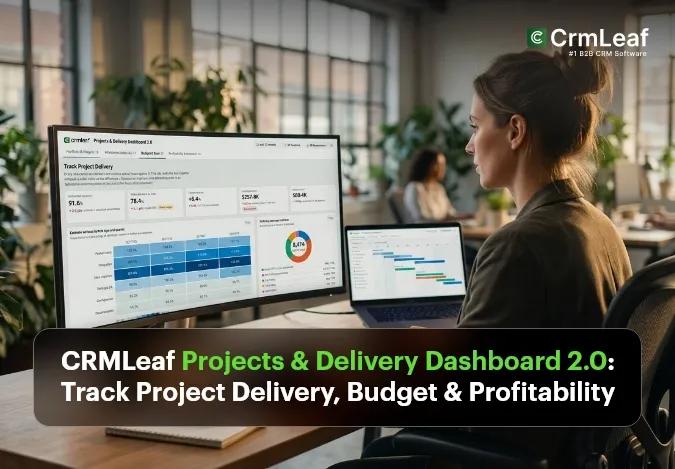
The CRMLeaf Projects & Delivery Dashboard is a dashboard in CRMLeaf Dashboard 2.0 that brings project delivery information into one place.
It is built for professional services firms that run client projects and need to see how those projects are progressing, spending, and earning.
The dashboard provides visibility into project portfolio and lifecycle information; milestones, tasks and SLA; budget and burn; estimation and delivery cost; and profitability and forecasting.
Each of these has its own tab, so a project leader can move from a high-level view to the detail behind it.
This article explains what each tab shows, how the dashboard fits into the CRMLeaf platform, and what to check before you rely on it.
Why Project Delivery Visibility Matters
Project problems are cheaper to fix when teams see them early.
A firm that reviews delivery, budget, and margin together can respond while a project is still running.
Services firms often face the same issues:
- Late milestones. A missed milestone can delay both delivery and the invoice that depends on it.
- Hidden overruns. Hours can pass the estimate before anyone reviews the budget.
- Unclear margin. Margin to date on an unfinished project may not show how it will end.
The dashboard puts these signals in one place. However, it does not remove the problems. Instead, it helps teams see them sooner.
What Is the Projects & Delivery Dashboard?
The Projects & Delivery Dashboard is the CRMLeaf view for reviewing the health of client projects.
It covers delivery progress, budget, cost, and profit across the whole project portfolio.
Details:
CRMLeaf is a professional services automation (PSA) platform.
PSA software connects the work firms do for clients with the time, cost, and billing that come from it. The Projects & Delivery Dashboard is where you review that connection at project level.
It sits alongside the other Dashboard 2.0 views, such as Finance, Resources, and Time.
It reads from project, task, and time records kept in CRMLeaf, so project data does not need to be rebuilt in a separate report.
What Does the Projects & Delivery Dashboard Track?
It tracks five areas: portfolio and lifecycle; milestones, tasks and SLA; budget and burn; estimation and delivery cost; and profitability and forecasting.
Each area answers a different question. The table below summarises them.
| Tab | Question it helps answer | What you review |
| Portfolio & lifecycle | What is running, starting, and closing? | Active projects, project type, practice, client, duration |
| Milestones, tasks & SLA | Is delivery on schedule? | Milestones due and missed, overdue tasks, SLA attainment |
| Budget & burn | How much of the budget is used? | Budget consumed, hours variance, projects over budget |
| Estimation & delivery cost | How good are our estimates, and what do overruns cost? | Estimation accuracy, cost of overrun, rework cost |
| Profitability & forecast | What margin will projects finish with? | Portfolio margin, forecast margin, revenue forecast |
Project Portfolio and Lifecycle
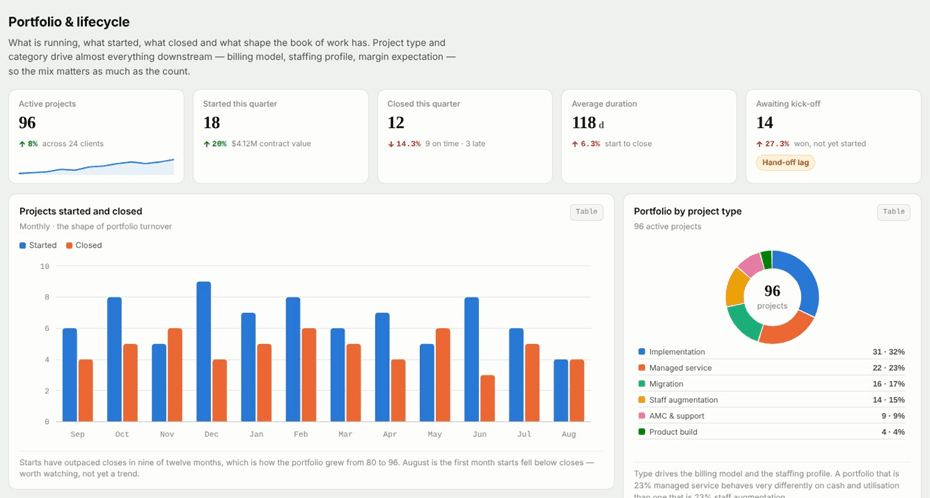
The Portfolio & lifecycle tab shows what is running, what started, and what closed.
It helps leaders see the shape of their project portfolio before they look at individual projects.
Feature: Portfolio & lifecycle.
What it shows: Active projects, projects started and closed over time, and the portfolio split by project type, practice, client, and billing model.
It also covers average project duration, projects awaiting kick-off, and projects closed on time.
Why it matters: Project type affects billing model, staffing, and expected margin. Therefore, seeing the mix, not just the count, may help leaders plan resourcing and spot imbalances early.
Milestones, Tasks and SLA
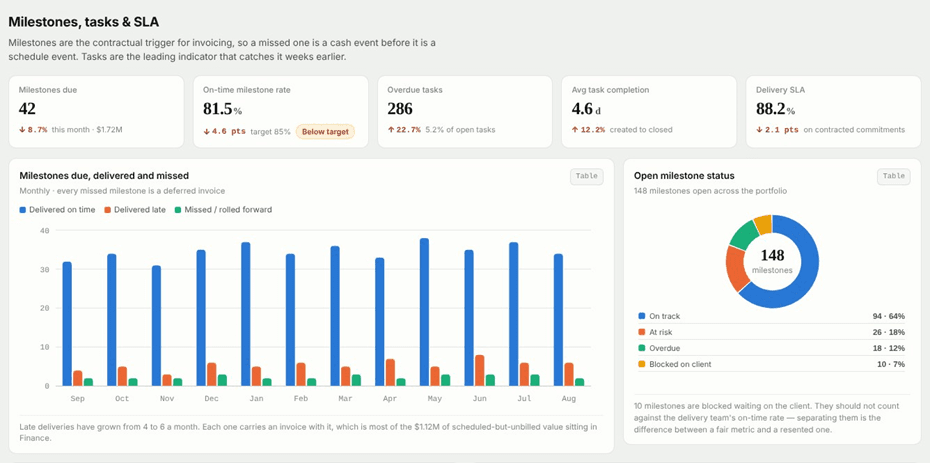
The Milestones, tasks & SLA tab shows whether project delivery is on schedule.
It tracks milestone status, task backlog, and delivery SLA attainment.
Feature: Milestones, tasks & SLA.
What it shows: Milestones due, delivered on time, delivered late, or missed.
It also shows open milestone status, overdue tasks by project, task completion time by task type, task throughput against backlog, and SLA attainment by practice.
Why it matters: Milestones often trigger invoices. A late milestone can therefore delay billing as well as delivery. Overdue tasks tend to appear earlier than a missed milestone, so reviewing them may give teams more time to respond.
The dashboard also separates milestones that are blocked on the client. As a result, reviewing them apart from internal delays may give a fairer picture of delivery team performance.
How Does CRMLeaf Help Monitor Project Budgets?
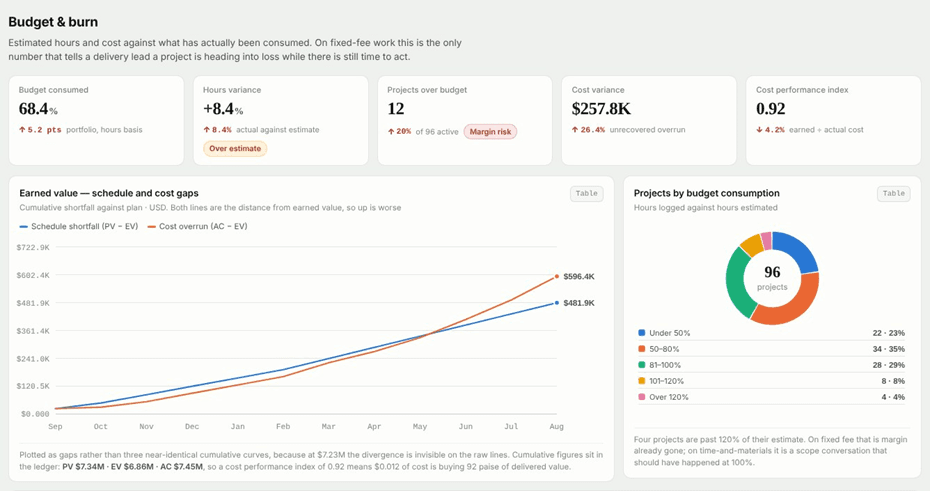
The Budget & burn tab compares estimated hours and cost with what projects have actually used.
It helps project leaders review the financial position of each project while work is still in progress.
Feature: Budget & burn.
What it shows: Budget consumed across the portfolio, hours variance against estimate, the number of projects over budget, and cost variance.
It also shows a cost performance index, an earned value view, budgeted versus actual hours by project, and budget threshold alerts.
Why it matters: On fixed-fee work, hours beyond the estimate are not billed.
Reviewing budget use during delivery may give leaders time to act, for example by reviewing scope, before an overrun grows.
What Is Project Budget Burn?
Project budget burn is the rate at which a project uses its estimated hours or cost.
A project that has used most of its budget with much work left is burning faster than planned.
In the dashboard, you read burn by comparing hours logged with hours estimated.
Similarly, a burn-down view compares the remaining estimated hours of a project with its planned pace. When actual remaining hours fall faster than planned, the project is using its budget early.
Estimation and Delivery Cost
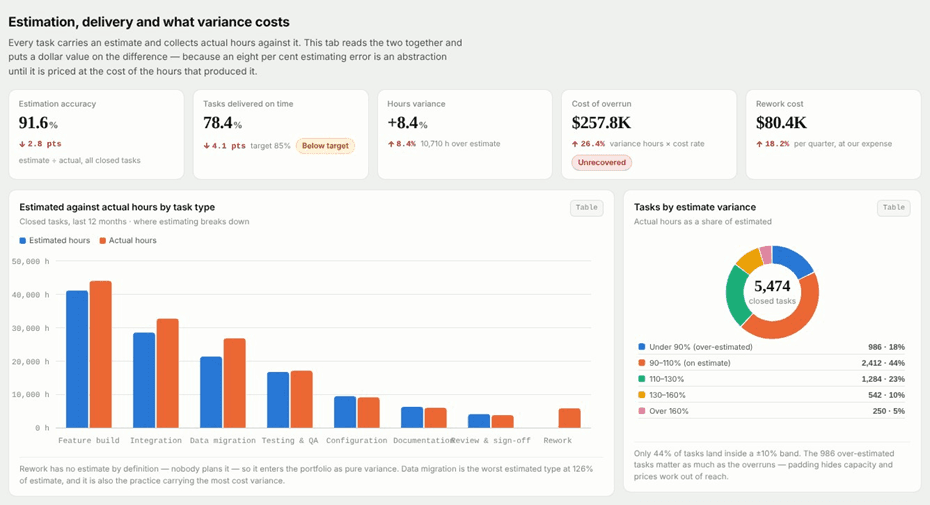
The Estimation & delivery cost tab compares estimated hours with actual hours and shows what the difference costs.
It also helps firms see where estimating is accurate and where it is not.
Feature: Estimation & delivery cost.
What it shows: Estimation accuracy, on-time task delivery, hours variance, cost of overrun, and rework cost.
Charts break down estimated versus actual hours by task type, estimation accuracy by task type, and variance by project.
Why it matters: A percentage error in estimates can be hard to act on. However, putting a cost on the extra hours may help leaders judge which projects, task types, or practices need a different estimating approach.
How Does Project Delivery Cost Visibility Help?
Delivery cost visibility shows what the hours spent on a project cost the firm.
As a result, this may help leaders compare cost with the revenue a project brings in.
The dashboard values hours over estimate at a cost per billable hour.
On time-and-materials work, many extra hours can still be billed. On fixed-fee work, they cannot.
Seeing that difference helps explain why two overruns of the same size can affect margin very differently.
Can CRMLeaf Show Project Profitability?
Yes. The Profitability & forecast tab shows margin for the project portfolio, forecast margin at completion, and revenue against delivery cost for individual projects.
Feature: Profitability & forecast.
What it shows: Portfolio margin, forecast margin at completion, projects below the margin target, revenue forecast, and backlog.
Charts compare margin to date with margin at completion, revenue against delivery cost for large projects, margin by project type, and the largest forecast overruns.
Why it matters: Margin to date on a half-finished project is only a partial reading.
Forecast margin applies current performance to the remaining work, so it may give a more realistic view of how a project will end.
How Can I Monitor Project Budget, Cost, and Profitability?
Review three tabs in order:
Budget & burn for hours used, Estimation & delivery cost for what overruns cost, and Profitability & forecast for the expected margin.
- Check budget and burn. Open Budget & burn and look at budget consumed, hours variance, and projects over budget.
- Review delivery cost. Open Estimation & delivery cost to see estimation accuracy and the cost of hours over estimate.
- Compare revenue and cost. Open Profitability & forecast to compare revenue with delivery cost on large projects.
- Check forecast margin. Review margin at completion and the projects below the margin target.
Moving in this order goes from hours, to cost, to profit. In other words, each step adds one layer to the same project.
How the Dashboard Fits Into CRMLeaf’s PSA Platform
The dashboard connects project delivery with the rest of CRMLeaf.
Project, task, time, and billing records feed the same views, so delivery data does not sit apart from financial data.
As PSA Software , CRMLeaf links several areas of a services business. First, sales deals become projects. Then, tasks and time logs record the work. Resource cost rates then value that work. Finally, invoices record what the firm has billed.
For example, a late milestone appears in the Milestones tab. The same milestone may also hold up an invoice, which the Finance Dashboard tracks as scheduled but unbilled work. Reviewing both views together shows the delivery cause and the billing effect.
Teams that already use project management in CRMLeaf can use the dashboard as the summary layer above their project and task lists.
Can CRMLeaf Help Me Manage Project Delivery?
Yes. CRMLeaf holds the project, task, milestone, and time records that delivery depends on, and the dashboard summarises them.
The dashboard is where you review delivery. However, teams manage the work itself in the project and task records.
The dashboard does not replace day-to-day project management. Instead, it sits above it. Project managers keep working in tasks and milestones.
Meanwhile, leaders use the dashboard to see which projects, practices, or clients need attention.
If you want to see how this works with your own project data, you can schedule a demo.
How to Open and Use the Dashboard
In CRMLeaf, go to More, then Dashboard, and select the Projects & Delivery dashboard. Then review one tab at a time.
A simple weekly or monthly routine works well:
- Portfolio: check what started, closed, and is awaiting kick-off.
- Delivery: review overdue tasks and late milestones.
- Budget: look at projects close to or over their estimate.
- Profit: review projects forecast below the margin target.
The dashboard is only as accurate as its inputs. Therefore, keep estimates, tasks, and time logs up to date.
Who Should Use the Projects & Delivery Dashboard?
It is most useful to people who are responsible for project delivery, project margin, or the project portfolio.
This includes delivery heads, project managers, finance leaders, and firm owners.
| Role | What they may look for | Useful tab |
| Owner or managing director | Portfolio mix, forecast margin | Profitability & forecast |
| Delivery head | Overdue tasks, milestone and SLA performance | Milestones, tasks & SLA |
| Project manager | Budget consumed, burn on active projects | Budget & burn |
| Finance lead | Cost of overrun, margin below target | Estimation & delivery cost |
These roles are practical examples. However, they are not fixed permission settings in the product.
Key Terms Explained
These are the main measures used in the dashboard, defined in plain terms.
| Term | Meaning |
| Budget consumed | Hours logged compared with hours estimated. |
| Hours variance | Actual hours compared with estimated hours. |
| Cost variance | The cost of hours over estimate that was not recovered. |
| Earned value (EV) | The value of work actually completed. |
| Cost performance index | Earned value divided by actual cost. Below 1 means cost is higher than the value delivered. |
| Estimate at completion | The forecast total cost of a project at current performance. |
| Estimation accuracy | Estimated hours divided by actual hours. |
| Forecast margin | The margin a project is expected to finish with. |
What to Know Before You Rely on It
The dashboard is a reporting view. Some figures depend on records and settings being maintained, and a few views need extra inputs.
- Estimates and time logs. Estimation and budget views rely on estimates and logged hours. If tasks lack estimates, the comparisons will be incomplete.
- Cost per hour. Delivery cost and margin use an hourly cost derived from declared CTC. It is a reporting value, not a stored field, and it may be unavailable for resources paid on a vendor bill.
- Forecast margin. It needs a remaining-work estimate for each project to be meaningful.
- Variance causes. Splitting overruns by cause, such as scope added without a change request, needs a variance-reason field on tasks.
- Backlog. It is a calculated metric with no stored record behind it, so it needs a scheduled calculation.
Therefore, treat these as signals to investigate, and confirm financial figures against your accounting system.
A Clearer Way to Review Project Delivery
The Projects & Delivery Dashboard brings portfolio, milestones, budget, delivery cost, and profitability into one place inside CRMLeaf.
It helps teams review delivery and finance together instead of in separate reports.
It works best when estimates, tasks, and time logs are kept current. Used that way, it gives project leaders a consistent starting point for the questions they ask every week.
Disclaimer: All figures, charts, and names in the images are illustrative examples from the dashboard mockup, not customer data or guaranteed results. Also, features and layouts may differ in your CRMLeaf account.