

⚡ TL;DR
- Hours: Track total, billable and non-billable hours.
- Plan vs. actual: Compare logged time with planned (allocated) hours.
- Compliance: Spot submission, approval, rejection and missing-entry problems.
- Billable performance: See billable share by resource, project, practice and client.
- Rates and write-offs: Compare standard rates with realised rates and see where hours are written off.
- Revenue visibility: Connect time data with billing and revenue insight.
Knowing how many hours your team works is not enough. Professional services leaders also need to know where that time goes, how much is billable, whether timesheets are submitted and approved on time, and how much billable effort turns into invoiced revenue.
Most teams answer these questions from separate reports. Hours sit in one place, approvals in another and billing rates in a third.
CRMLeaf Time & Timesheets Dashboard 2.0 connects them in one flow:
Track Time → Validate Time → Approve Time → Measure Billability → Understand Realisation → Improve Revenue Visibility
What Is CRMLeaf Time & Timesheets Dashboard 2.0?
It is a time tracking dashboard that shows where hours go, whether time data can be trusted, and how billable time turns into realised revenue. It has three connected tabs:
- Time Logged: where working hours are going.
- Compliance & Approvals: whether timesheets are submitted, approved, rejected or missing.
- Billing Rates & Realisation: how billable time converts into revenue, and where value is lost.
Don’t read them separately. Time data is the starting point. Compliance improves data quality. Billing and realisation show the financial impact. Late or rejected timesheets weaken utilization reports, project cost and time-and-materials invoices.
Time Logged: See Where Every Hour Goes
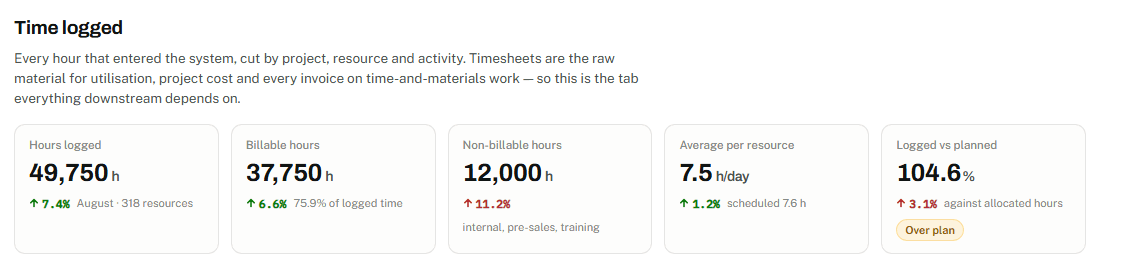
The Time Logged tab shows how total hours split across billable work, internal work and other activity. It tracks:
- Total hours logged
- Billable and non-billable hours
- Average hours per resource, against scheduled hours
- Logged versus planned hours
- Hours by activity type, project, practice and day of week
- Billable share by resource
- Time-entry lag
- Rework, pre-sales and overtime hours
Each view answers a different question:
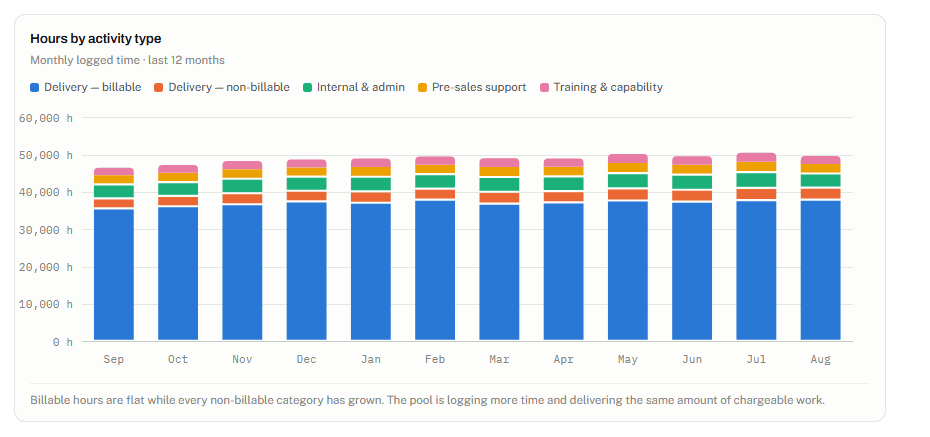
- Activity type shows whether internal, training or pre-sales time is growing.
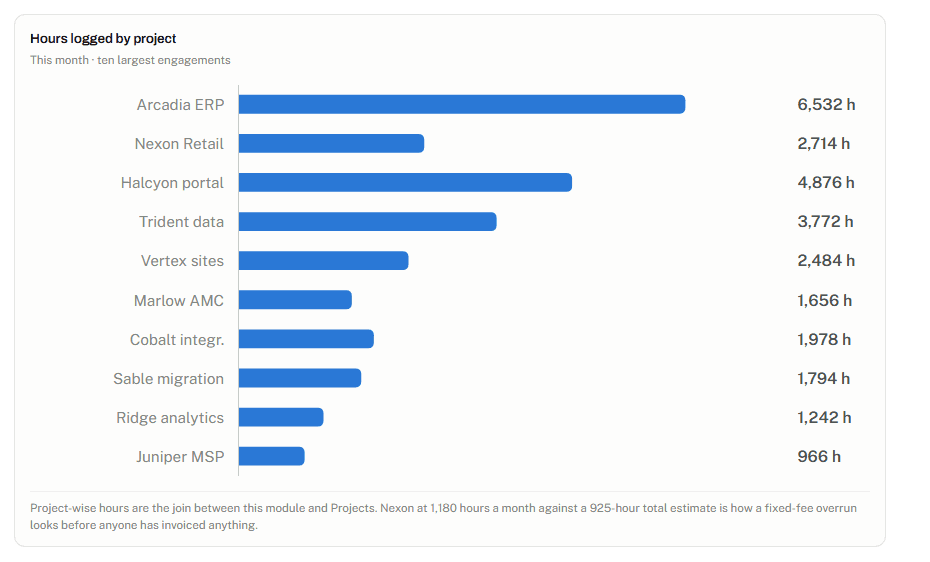
- Project hours show where effort is concentrating.
- Billable share by resource shows who is carrying non-billable work.
- Time-entry lag shows how current the data is.
- Rework and pre-sales hours show effort that is unlikely to be invoiced.
No single metric proves poor performance. Each one points to a question for management.
Turn Raw Time Data Into Actionable Insights
Planned vs. Logged Hours
When logged hours keep exceeding planned hours, don’t assume higher productivity. The cause may be:
- inaccurate allocations
- scope changes
- workload imbalance
- estimation issues
 Logged hours against planned hours
Billable vs. Non-Billable Time
A growing non-billable share can come from internal work, pre-sales effort, training or administrative overhead. Some of that is healthy. The goal is to see it, then decide whether billable capacity can improve. This links directly to resource utilization.
Project-Level Hours
Project hours can signal possible budget overruns, scope creep, inefficient delivery or rework. They are signals to investigate, not verdicts.
Compliance & Approvals: Make Timesheet Data More Reliable
Timesheet compliance is how consistently people submit complete, correct timesheets, and how quickly those timesheets are approved. This tab tracks:
- Submission rate and on-time submission rate
- Approved, rejected and pending timesheets
- Approval lag and overdue approvals
- Missing days
- Resubmission rate
- Entries edited after approval
- Weekend and after-hours entries
- Locked periods reopened
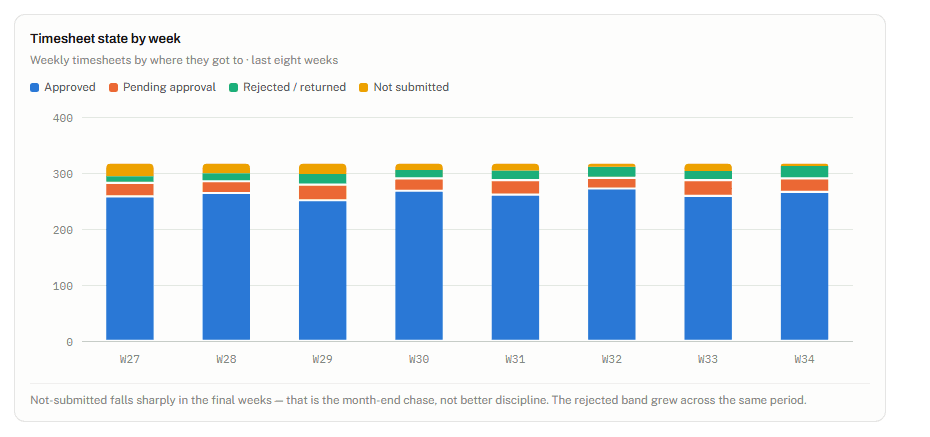
Views by week, department and resource show where compliance breaks down. One caution: a drop in “not submitted” late in the month may reflect a month-end chase, not better discipline.
Identify Why Timesheets Are Rejected
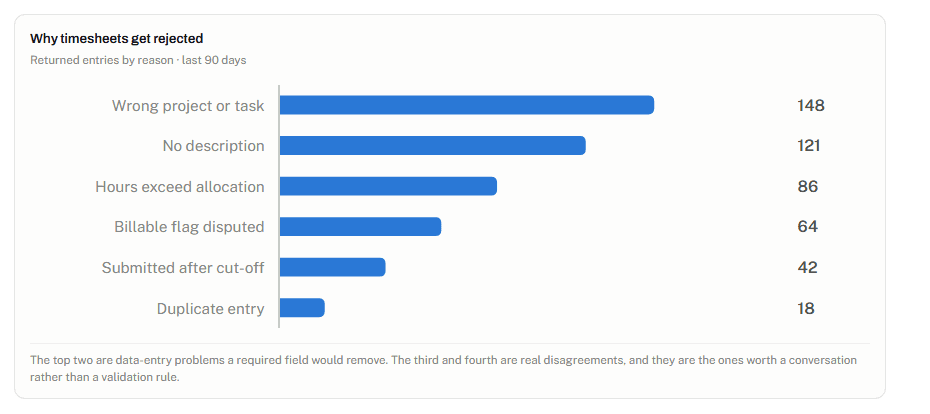
The dashboard groups returned entries by reason:
- Wrong project or task
- No description
- Hours exceed allocation
- Billable flag disputed
- Submitted after cut-off
- Duplicate entry
These reasons separate data-entry problems from real operational or billing disagreements. Wrong project and missing descriptions are entry errors that a required field could prevent. “Hours exceed allocation” and “billable flag disputed” need a conversation, not a validation rule.
Find Approval Bottlenecks
Approval-lag analysis shows where timesheets wait for a decision, broken down by approver.
 Approval lag by approver
When most of the delay sits with a few approvers, the fix is simple: reassign, delegate or set reminders for those queues. That is far easier than retraining a whole team.
The reason matters: on time-and-materials work, approval delays can create downstream billing delays when approved time is required before invoicing.
Billing Rates & Realisation: Connect Time to Revenue
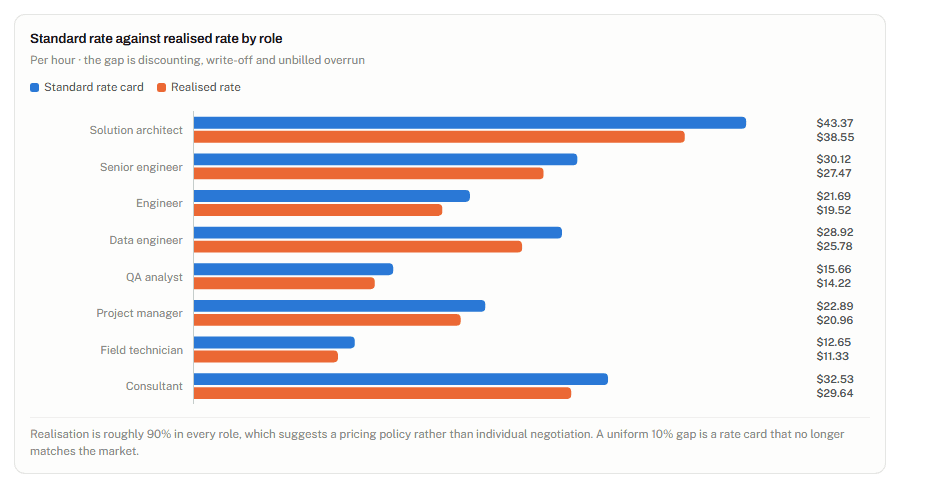
This tab shows what an hour was quoted at, what it was billed at, and what survived to the invoice. Three terms matter:
Standard rate → Realised rate → Realisation percentage
- Standard rate: the published rate before discounting.
- Realised rate: invoiced value ÷ billable hours.
- Realisation: realised rate ÷ standard rate.
Other metrics on the tab include:
- Write-off hours and write-off value
- Revenue per logged hour
- Unbilled billable hours
- Hours eligible to invoice, and eligible-hours conversion
- Realisation by project and by billing type
- Write-off reasons
- Rate tiers
Product note: the source states that a blended realised rate can be derived because CRMLeaf records billable hours and invoice value. Full realisation needs a stored standard rate card per role, client and project. Confirm this against the live product before promising it.
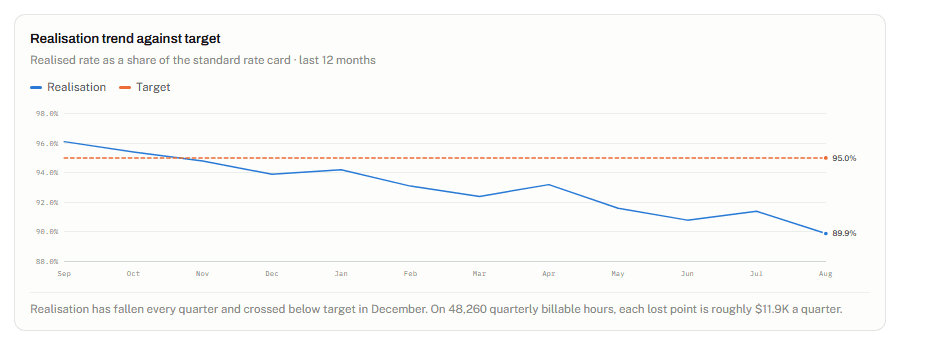
Rate Erosion vs. Volume Shortfall
Lower revenue can come from two different causes, and they need different fixes.
Rate erosion means less revenue per billable hour, from negotiated rates, discounts, rate caps or fixed-fee economics. The fix lives in pricing and contracts.
Volume shortfall means fewer billable hours than expected. The fix lives in planning, utilization and sales.
A revenue total hides the difference. Realisation and billable hours, viewed together, separate them.
Understand Write-Offs
Write-offs are billable hours that were delivered but never invoiced. The dashboard groups them by reason:
- Fixed-fee overrun
- Scope dispute
- Goodwill or relationship
- Rework at our cost
- Missed billing window
- Rate cap reached
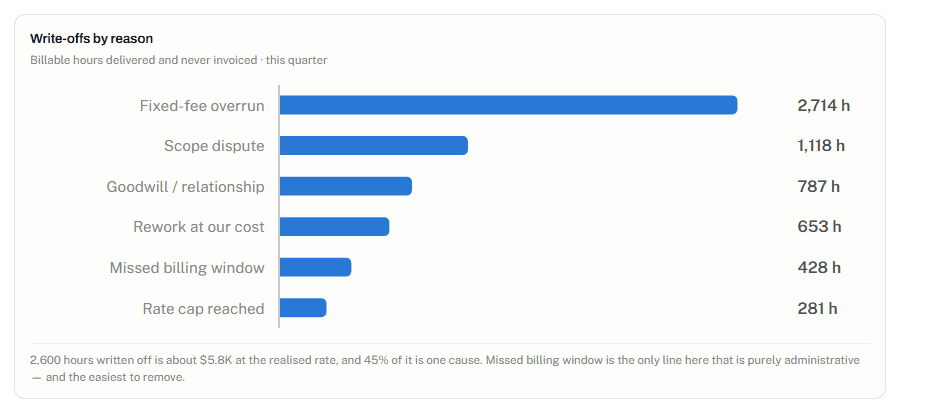
The reasons point to different owners:
- Operational problems: fixed-fee overruns suggest estimation, scope or delivery issues.
- Commercial decisions: goodwill and rate caps are choices, which should be made on purpose.
- Administrative mistakes: a missed billing window is the clearest example, and the easiest to remove.
The source also notes that recording a write-off reason on the timesheet or invoice line is needed to support this view.
Realisation by Project and Billing Type
Project-level realisation exposes engagements where effort is producing a lower rate than the standard. A project that runs well over its budgeted hours often shows up here, because the extra hours were delivered but never billed.
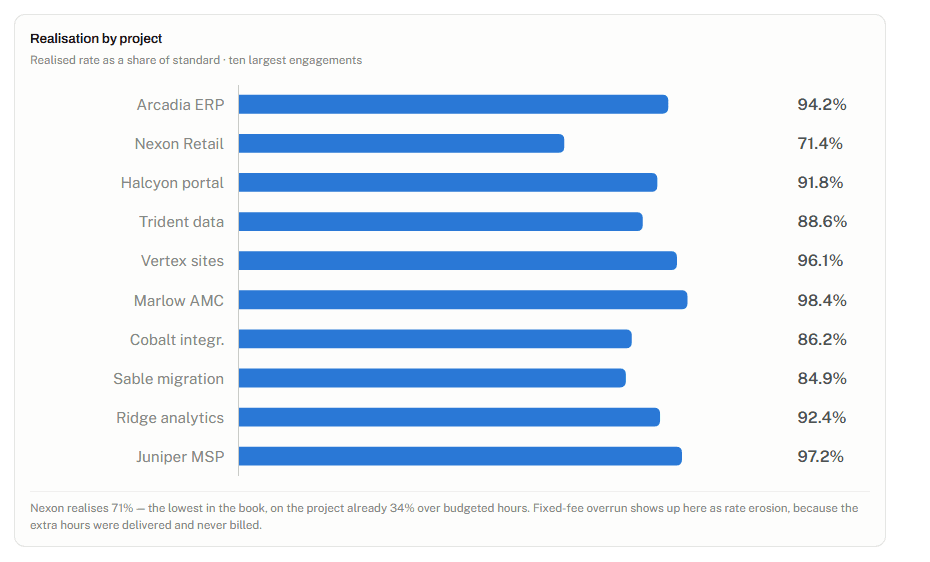
Billing type matters too. Time-and-materials quoted rates tend to hold steady. Fixed-fee derived rates fall when projects use more hours than scoped. Viewing the two separately shows whether pricing or scoping needs attention.
 Realised rate by billing type
How the Three Dashboard Sections Work Together
The tabs form one workflow from hours to revenue.
- Track: capture hours by project, resource, activity, practice and client.
- Validate: monitor submission quality, missing entries and rejections.
- Approve: reduce approval delays so time data is reliable.
- Measure: compare billable hours, rates, realisation and write-offs.
- Act: improve planning, utilization, billing discipline and revenue visibility.
If the validate step is weak, the measure step reflects incomplete data. That is why compliance is part of billing, not a separate admin task.
How Time & Timesheets 2.0 Helps Professional Services Teams
Project Managers
Compare planned and actual hours, watch project-level time for overruns and rework, and see delivery effort sooner. See project management.
Resource Managers
Check billable share by resource, non-billable work and capacity signals. Pair this with the Team Utilization Calculator.
Finance Teams
Review billable and approved hours, realised rates, write-offs, unbilled hours and invoice eligibility. This feeds invoicing and finance.
Operations Leaders
Track compliance, approval bottlenecks, department patterns and time-entry quality. When submission rates stay stable within a department but differ between departments, that points to management behaviour, not a system issue.
Why a Dashboard Beats Isolated Timesheet Data
Manual tracking often means combining separate spreadsheets and reports. A connected dashboard lets teams view time, compliance, project effort, billability, rates, realisation and write-offs in one analytical flow. That makes it easier to link a late timesheet to a delayed invoice. It also suits teams adopting PSA software and time tracking.
Key Metrics to Monitor
|
Metric |
What It Tells You |
Why It Matters |
| Total hours logged | All time entered in the period | Sets the base for every ratio |
| Billable hours | Client-chargeable time | Drives invoiceable revenue |
| Billable share | Billable ÷ total logged | Shows productive time |
| Logged vs. planned hours | Actual against allocation | Flags planning mismatch |
| Submission rate | Expected timesheets submitted | Shows data reliability |
| Approval lag | Days from submission to decision | Shows approval bottlenecks |
| Missing days | Working days with no entry | Shows gaps in time data |
| Rejection rate | Share of timesheets returned | Shows entry and billing friction |
| Realisation rate | Realised ÷ standard rate | Shows rate erosion |
| Realised rate | Invoiced value ÷ billable hours | Shows actual yield per hour |
| Write-off hours | Billable hours never invoiced | Shows lost billable effort |
| Unbilled billable hours | Delivered, chargeable, not yet invoiced | Shows invoicing backlog |
Conclusion
Effective time management is not just recording hours. It is a chain:
Logged Time → Accurate Timesheets → Approved Time → Billable Work → Realised Revenue
CRMLeaf Time & Timesheets Dashboard 2.0 brings these links together. Teams can see where time goes, where billable value is lost and where management attention is needed.
Explore CRMLeaf for your time tracking, timesheet and billing workflows.