

⚡ TL;DR: CRMLeaf Resource Dashboard 2.0
- Capacity: See allocatable people, available hours and how much is already booked, by role and by week.
- Bench and overload: Spot unallocated and over-allocated resources before they become cost or burnout problems.
- Utilization: Separate “booked” from “billable” and track billable utilization against a target.
- Economics: Connect cost per hour, billing rate, contribution and revenue for each resource and role.
- Non-human resources: Track AI tools, software seats and equipment alongside people.
- Forecast: Compare future capacity with committed and probable demand, role by role.
A large team does not guarantee the right capacity. Many professional services firms see all of this at once:
- People sitting on the bench
- Employees working below capacity
- Critical roles booked close to 100%
- Staff split across several projects
- Future demand that does not match today’s team
In fact, each problem looks small in a spreadsheet. Together, they quietly erode margin and burn out good people.
CRMLeaf Resource Dashboard 2.0 brings these signals into one view. It links professional services resource management data (availability, allocation, utilization, cost, return and forecast) so leaders can act earlier.
What Is CRMLeaf Resource Dashboard 2.0?
CRMLeaf Resource Dashboard 2.0 is a resource management dashboard that shows how much capacity a services business has, where it is allocated, how productively it is used, what it costs and what demand is coming.
The design follows one flow:
Capacity → Allocation → Utilization → Cost → ROI → Forecast
However, most tools stop at availability. This dashboard goes further. It asks whether booked time is billable, whether billable time is profitable, and whether next quarter’s demand fits the team you have.
Three definitions used throughout this article:
- Resource capacity: The amount of work a team or resource can realistically take on in a defined period.
- Resource allocation: The amount of available capacity assigned to projects or work.
- Resource utilization: The percentage of available working capacity being used, particularly for billable work.
The dashboard has six sections: Availability & Allocation, Utilization & Billability, Rate Model & Cost, Resource ROI, Non-Human Resources, and Forecast & Demand.
Key Resource Metrics at a Glance
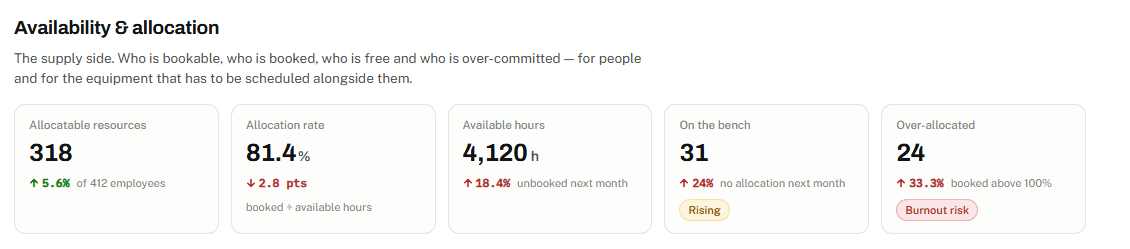
A resource performance dashboard should answer three questions: what capacity do we have, how well is it used, and what does it earn? The table below shows the main KPIs and why each matters.
| Metric | What it means | Why it matters |
| Allocatable resources | People available for project booking | Defines the true delivery pool |
| Allocation rate | Booked hours ÷ available hours | Shows how full the team is |
| Available hours | Unbooked capacity in the period | Shows what can still be sold |
| Bench headcount | People with no allocation | Flags idle cost |
| Over-allocated resources | People booked above 100% | Signals burnout and delivery risk |
| Billable utilization | Billable hours ÷ available hours (net of leave and holidays) | Measures productive capacity |
| Total utilization | All booked hours ÷ available hours | Includes internal work |
| Billable / non-billable hours | Chargeable vs. non-chargeable time | Shows where time goes |
| Cost per paid hour | Loaded cost ÷ all paid hours | Shows the cost of employment |
| Cost per billable hour | Delivery cost ÷ billable hours | Shows the cost of delivered work |
| Contribution per hour | Project rate minus cost per billable hour | Shows margin on each hour |
| Revenue generated | Billable hours × project rate | Shows what resources earn |
| Forecast utilization | Expected utilization under a demand scenario | Shows future workload |
| Committed demand | Hours on signed work | Shows secured work |
| Available capacity | Bookable hours net of leave | Shows supply |
| Capacity gap | Capacity minus committed demand | Shows surplus or shortage |
1. Availability & Allocation: See Where Your Team Capacity Stands
Availability & Allocation shows who is bookable, who is booked, who is free and who is overcommitted.
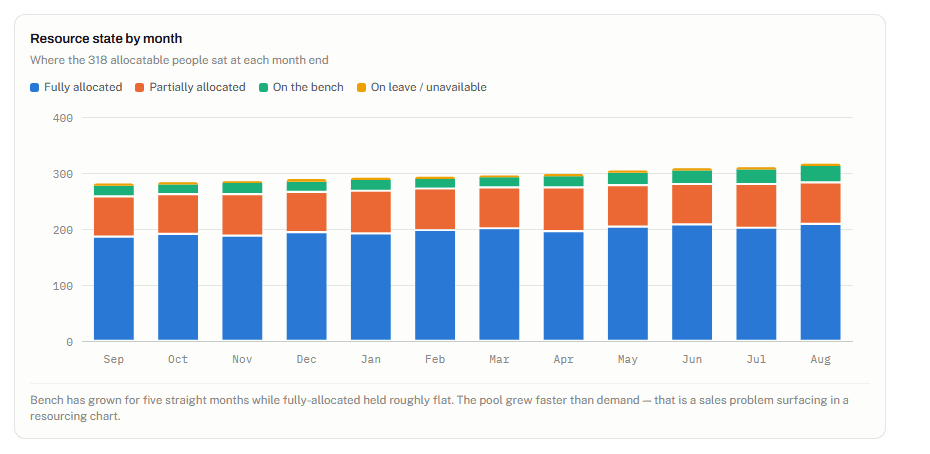
Resource State
The dashboard groups allocatable people into four states: fully allocated, partially allocated, on the bench, and on leave or unavailable. People in non-delivery functions sit outside the utilization base on purpose, so they don’t distort the numbers.
Capacity Analysis
The dashboard compares available hours, allocated hours and free hours, and breaks them down by role. In fact, this is where a blended number misleads. One role can be booked almost to capacity while another has plenty of room. However, a single “percent allocated” figure hides both facts.
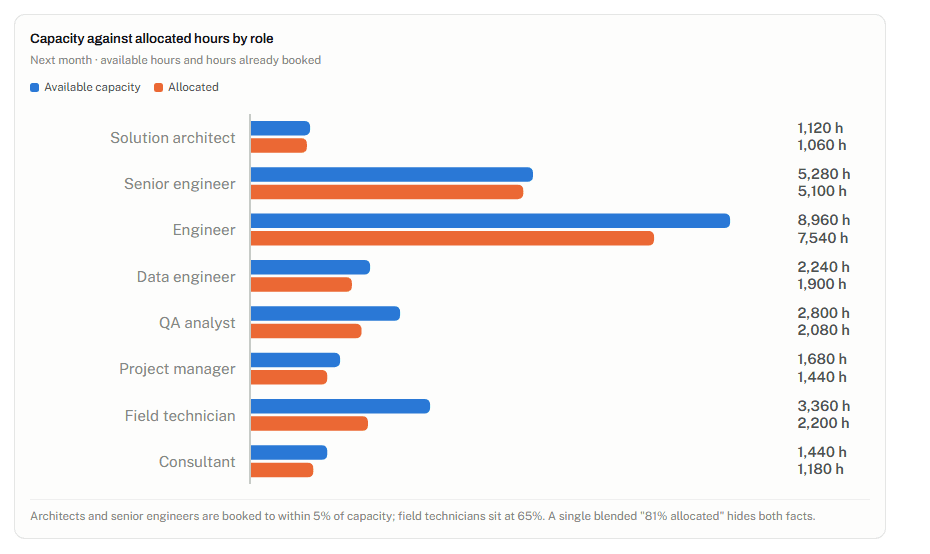
Similarly, free hours by role matter just as much. A pool can show many free hours overall while having almost none in the scarce role that upcoming deals need.
Allocation by Resource and Week
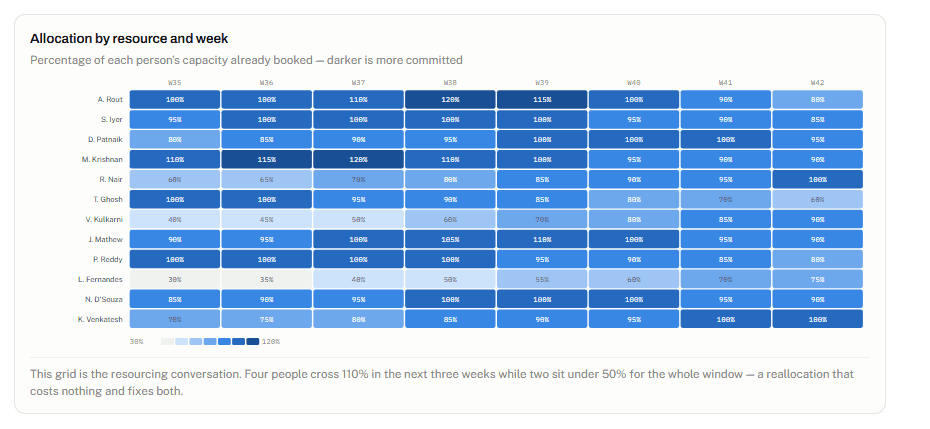
A weekly heat map shows each person’s booked percentage across the coming weeks. It reveals:
- Overloaded people
- Under-utilized people
- Upcoming capacity gaps
- Reallocation opportunities
Moreover, moving work from an overloaded person to a free one, where skills match, costs nothing and fixes two problems.
Allocation by Project
Project-level allocation is measured in full-time equivalents (FTE), not headcount. This matters because a person split across several projects carries several partial commitments. The dashboard also tracks how many people work across multiple projects and the average number of projects per person, a simple view of context-switching load.
2. Utilization & Billability: Turn Capacity Into Productive Work
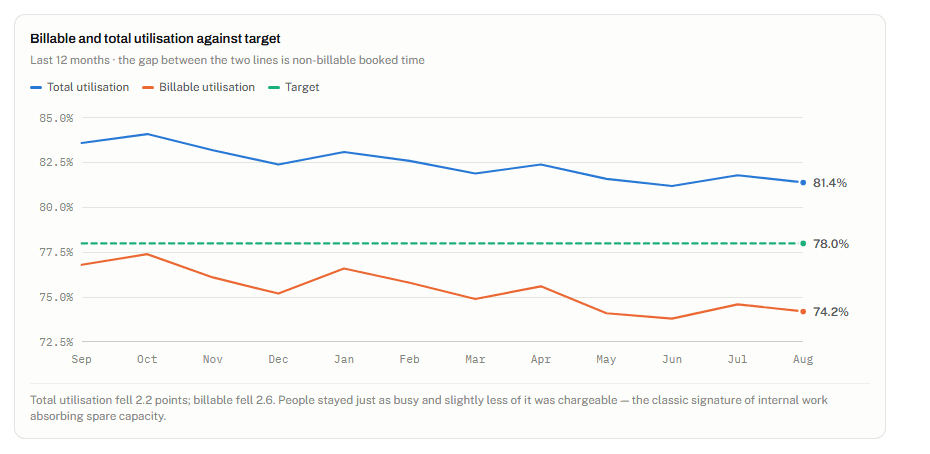
Allocation says a person is booked. Utilization says whether that booking produced billable work. However, being booked does not mean being billable.
The dashboard tracks:
- Billable utilization: Billable hours ÷ (available hours − leave − holidays)
- Total utilization: All booked hours ÷ available hours
- Non-billable hours: Internal work, pre-sales, training and rework
- Utilization targets: Actual compared with a configured target
Why One Number Hides the Real Picture
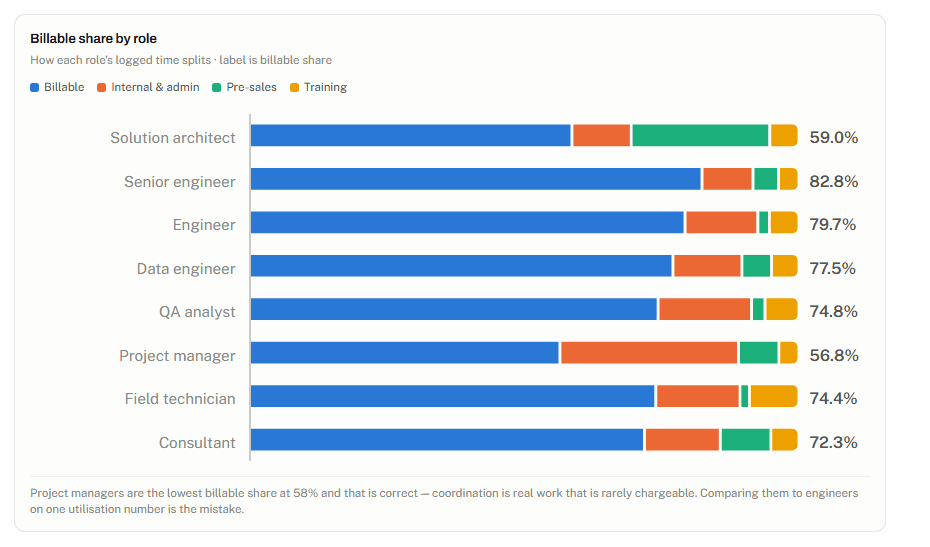
An organization-wide utilization figure averages very different realities. The dashboard breaks utilization down by role, location, practice and individual:
- By role: Project managers legitimately run lower billable shares than engineers. Comparing them on one target misleads.
- By practice: A managed services team should run hotter than an analytics team. Each practice needs its own target.
- By location: One office may lag because of real demand gaps or because of poor timesheet capture.
- By resource: One person can drift away from billable work for months while the company average barely moves.
In addition, listing the most under-utilized resources turns a metric into an action list.
3. Resource Cost & Rates: Connect Capacity With Profitability
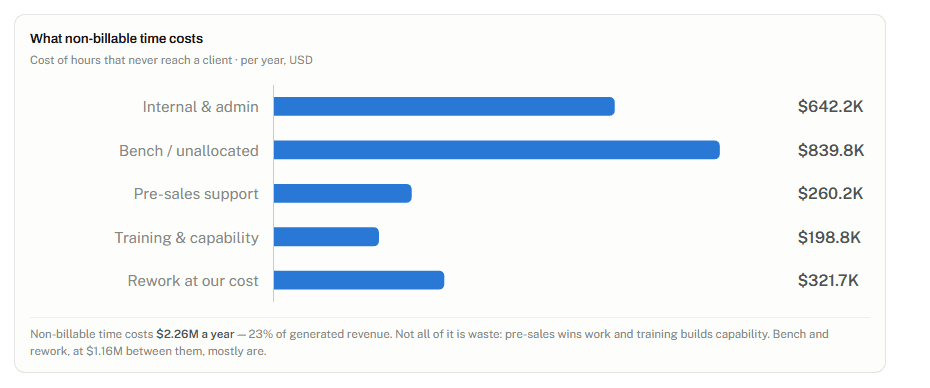
Planning should not stop at utilization, because a busy team can still lose money. The cost section links hours to dollars.
It covers cost per paid hour, cost per billable hour, employee hourly billing rate, project hourly rate, contribution per hour, cost by role, resource cost by project, gross margin by role and bench cost.
The key idea: billing rate ≠ resource cost.
- The employee hourly rate is the default rate charged to customers.
- The project hourly rate is that default overridden for one engagement.
- Cost is a different quantity: what the resource costs the business.
A Methodology Note
The source material derives cost from the declared CTC (cost to company) already held on the employee salary record. It must then be divided down to an hourly figure. The divisor you choose (calendar, available, allocated or billable hours) changes the answer significantly.
So the divisor is a policy decision. Define it before presenting cost as a production metric. The source also flags that the precedence between employee and project rates is an assumption to confirm in the application.
4. Resource ROI: Understand What Your Team Generates
Resource ROI compares what each resource costs with what they generate. First, cost accrues on every paid hour. However, revenue arrives only on hours that are billable, priced and invoiced.
The section covers revenue generated per resource, fully absorbed cost, contribution, contribution per resource, contribution per billable hour, resources below cost recovery, the cost of non-billable time and bench cost.
This moves management from “Are our people busy?” to “Are our resources generating profitable delivery capacity?”
Still, a resource below cost recovery is not automatically a performance problem. Low billable utilization is often the cause, and the fix there is allocation, not a performance review.
Therefore, interpret ROI alongside role, utilization, pricing, project mix and workload. It is not a simplistic employee-performance score. When contribution falls across every role at once, the cause is usually pricing or cost, not individuals.
5. Non-Human Resources: Manage More Than People
Services firms now deliver with AI tools, software licenses, equipment and vehicles, not just people. The dashboard concept places them in the same resourcing view.
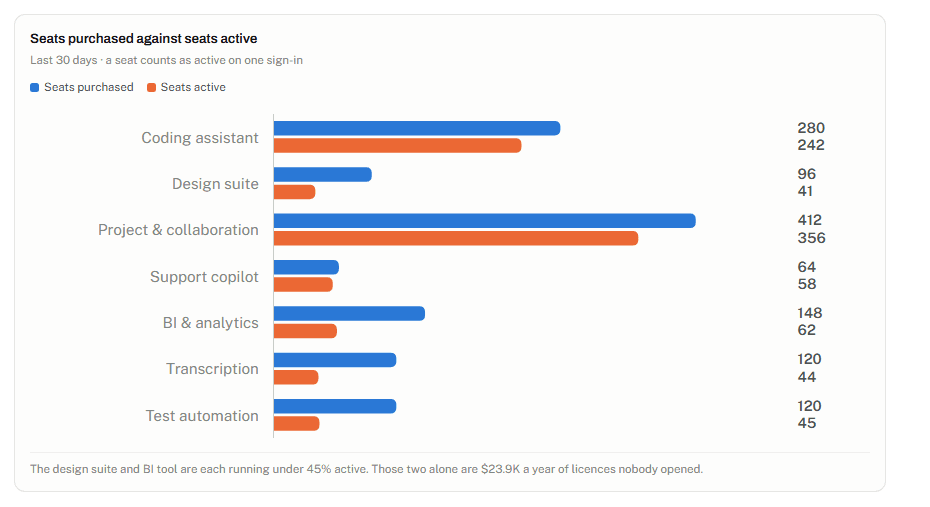
It tracks non-human resource cost, AI tool spend, seats purchased versus active, seat utilization, idle seats, cost per active seat, equipment availability and non-human cost by project.
Specifically, cost per active seat reveals waste that list prices hide. For example, a tool with low active use can cost several times what its list price suggests per real user.
Accuracy note: The source states this section is the least supported by CRMLeaf today. Tools and licenses currently exist as purchase orders and expenses, not as schedulable resources with seats, owners and project references. So, treat it as a design direction, not a confirmed live feature. Equipment, however, is described as already modelled as a schedulable resource.
6. Forecast & Demand: Plan Capacity Before the Problem Appears
Forecast & Demand puts capacity and demand on one axis, so hiring, bench and sales conversations use the same numbers.
The section covers:
- Available capacity and committed demand
- Weighted pipeline demand (pipeline hours at stage probability)
- Capacity gap
- Demand gap and surplus capacity by role
- Resource roll-offs
- Forecast utilization scenarios (committed only vs. with weighted pipeline)
- Hiring requirements, reassignment and subcontracting needs
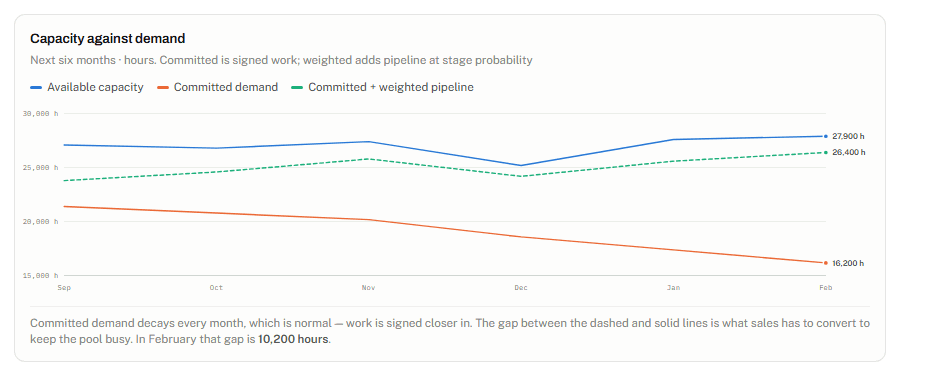
Overall Capacity vs. Role-Specific Capacity
This is the most important insight in the dashboard. A company can have surplus capacity overall and still be short of specific roles.
A pool can have plenty of unbooked hours next quarter and still be short of architects, data engineers or senior engineers. Meanwhile, other roles carry hours that nobody can book.
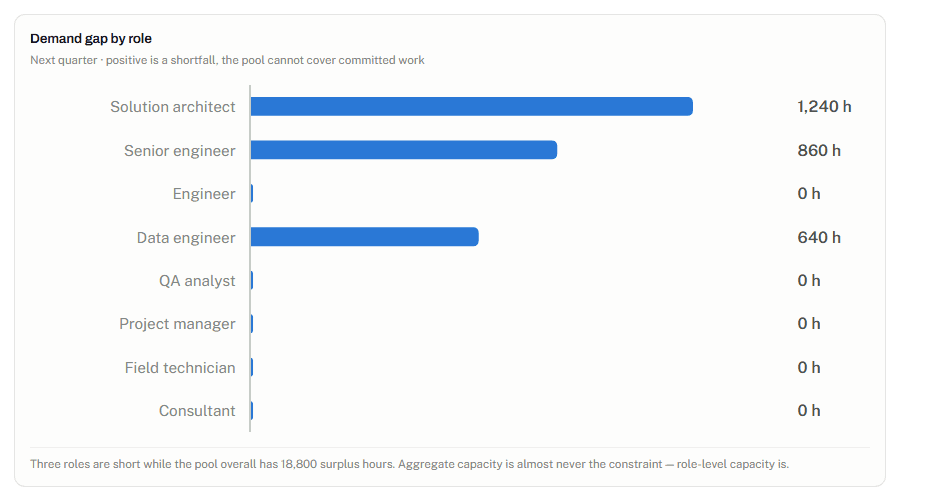 Demand gap by role
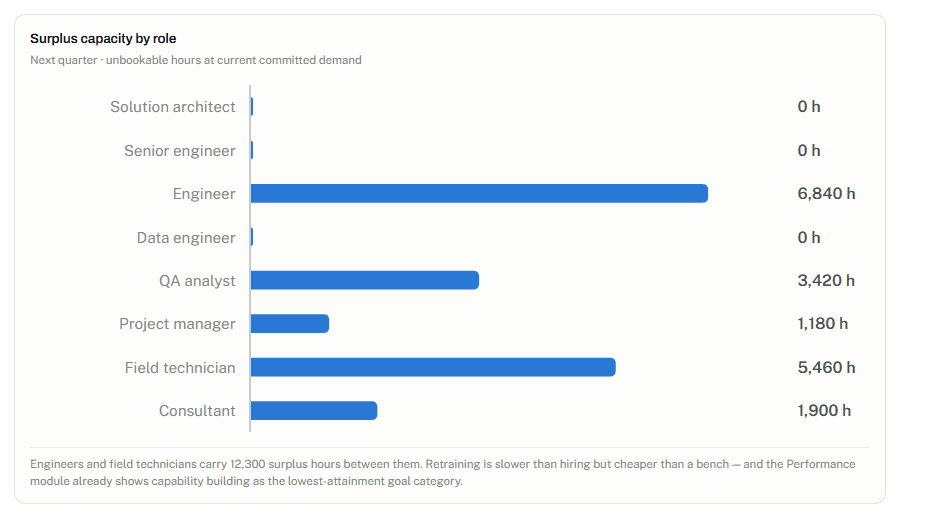 Surplus capacity by role
However, aggregate capacity is rarely the constraint. Instead, role-level capacity is. Also, each gap calls for a different lever: reassign, retrain, hire or subcontract.
What Is Supported Today
The source is explicit: committed demand can be derived from existing allocations today. The weighted pipeline view needs further product work, including a planned-hours profile per allocation, a stage-probability model and a utilization target to forecast against.
How CRMLeaf Resource Dashboard 2.0 Helps Improve Team Capacity
The dashboard improves team capacity by making supply, demand and economics visible together. However, it does not guarantee results. It gives managers earlier, better-informed decisions.
- Reduce bench time. Identify people with no upcoming allocation and the roll-offs about to create more.
- Prevent over-allocation. Spot resources approaching or exceeding 100% before quality or morale suffers.
- Improve utilization. Find under-utilized people and recoverable billable hours.
- Balance workloads. Shift work from overloaded to available people where skills and project needs match.
- Improve project profitability. Connect hours, cost, billing rates and contribution.
- Make better hiring decisions. Compare future demand with capacity before opening requisitions.
- Improve forecasting. Use committed work and expected demand to anticipate gaps.
Resource Dashboard vs. Spreadsheet-Based Resource Planning
Generally, spreadsheets work well for small teams with few projects. They become hard to scale as headcount, projects and roles multiply, because every number needs manual updating.
|
Area |
Spreadsheet-Based Planning |
Resource Dashboard |
| Capacity visibility | Manual | Centralized |
| Allocation tracking | Manual updates | Dashboard-based |
| Utilization | Separate calculations | Integrated metrics |
| Bench tracking | Difficult to maintain | Easier to identify |
| Forecasting | Manual models | Capacity vs. demand view |
| Resource cost | Often separate | Connected to resource economics |
| Decision-making | Reactive | More proactive |
A dashboard also pulls from connected time tracking and project management data, so numbers update as work happens.
Who Can Benefit From CRMLeaf Resource Dashboard 2.0?
Any project-based business that sells people’s time can benefit. Typical challenges include:
- IT services firms: Scarce senior skills, bench between projects and tool spend.
- Consulting firms: Utilization targets that differ by seniority.
- Architecture firms: Specialist roles that gate every new project.
- Staffing and recruitment organizations: Matching available people to demand quickly.
- Legal and professional firms: Billable targets balanced with non-billable work.
- Other project-based service businesses: Equipment and people scheduled together.
A PSA software platform suits these firms because it keeps projects, time, resources and finance in one system.
How to Use a Resource Dashboard for Better Capacity Planning
Review capacity, allocation, utilization, cost and demand in that order. A practical workflow:
- Review available capacity. Check total available hours and allocatable headcount.
- Check allocation by role. Find where capacity is tight and where it is loose.
- Identify bench and overloaded resources. List people well below and above full allocation.
- Review billable utilization. Compare with targets by role, practice and location.
- Investigate under-utilized capacity. Ask whether the cause is demand, skills or time capture.
- Connect cost to project economics. Compare cost per hour, billing rate and contribution.
- Review upcoming roll-offs. See who is coming free and whether they have a next booking.
- Compare future demand with capacity. Do this by role, not just in total.
- Decide whether to reallocate, sell, hire or subcontract. Match the lever to the gap.
- Monitor continuously. Revisit weekly or monthly as bookings change.
To check your own numbers, try the Team Utilization Calculator or the Resource Utilization GPT.
Conclusion
In short, effective resource management is not about keeping people busy. Instead, it is about aligning the right capacity, skills, cost and demand at the right time.
CRMLeaf Resource Dashboard 2.0 gives professional services leaders one place to see that full picture: from capacity and allocation through utilization, cost and ROI to forecast. Teams can spot problems earlier and choose between reallocating, selling, hiring and subcontracting with better evidence.
If you want to see how this fits your workflows, explore CRMLeaf for resource planning, projects, time tracking and invoicing.